Actions
At 실시간 현재가 차트 » 이력 » 개정판 1
개정판 1/3
| 다음 »
이태훈, 2025/02/12 04:40
At 차트UI생성
소스코드
import sys
import time
import pyupbit
import pybithumb
from PyQt5 import uic
from PyQt5.QtWidgets import QApplication, QWidget
from PyQt5.QtChart import QLineSeries, QChart, QValueAxis, QDateTimeAxis
from PyQt5.QtGui import QPainter
from PyQt5.QtCore import Qt, QDateTime, QThread, pyqtSignal

class PriceWorker(QThread):
    dataSent = pyqtSignal(float)

    def __init__(self, ticker):
        super().__init__()
        self.ticker = ticker
        self.alive = True

    def run(self):
        while self.alive:
            data = pyupbit.get_current_price(self.ticker) # 업비트 금액 조회
            # data = pybithumb.get_current_price(self.ticker) # 빗썸 금액 조회
            time.sleep(1) # 1초에 한번씩 갱신
            self.dataSent.emit(data)

    def close(self):
        self.alive = False
class ChartWidget(QWidget):
    def __init__(self, parent=None, ticker="KRW-BTC"): # 업비트 : KRW-BTC | 빗썸 : BTC
        super().__init__(parent)
        uic.loadUi("resource/chart.ui", self)
        self.ticker = ticker

        self.viewLimit = 128 # 가로 폭 갯수

        self.priceData = QLineSeries()

        self.priceChart = QChart()
        self.priceChart.addSeries(self.priceData)
        self.priceChart.legend().hide()

        axisX = QDateTimeAxis()
        axisX.setFormat("hh:mm:ss")
        axisX.setTickCount(4)
        dt = QDateTime.currentDateTime()
        axisX.setRange(dt, dt.addSecs(self.viewLimit))

        axisY = QValueAxis()
        axisY.setVisible(True)

        self.priceChart.addAxis(axisX, Qt.AlignBottom)
        self.priceChart.addAxis(axisY, Qt.AlignRight)
        self.priceData.attachAxis(axisX)
        self.priceData.attachAxis(axisY)
        self.priceChart.layout().setContentsMargins(0, 0, 0, 0)

        self.priceView.setChart(self.priceChart)
        self.priceView.setRenderHints(QPainter.Antialiasing)

        self.pw = PriceWorker(ticker)
        self.pw.dataSent.connect(self.appendData)
        self.pw.start()

# --------------------------------------------

    def appendData(self, currentPrice):
        if len(self.priceData) == self.viewLimit:
            self.priceData.remove(0)
        dt = QDateTime.currentDateTime()
        self.priceData.append(dt.toMSecsSinceEpoch(), currentPrice)
        self.__updateAxis()

    def __updateAxis(self):
        pvs = self.priceData.pointsVector()
        dtStart = QDateTime.fromMSecsSinceEpoch(int(pvs[0].x()))
        if len(self.priceData) == self.viewLimit:
            dtLast = QDateTime.fromMSecsSinceEpoch(int(pvs[-1].x()))
        else:
            dtLast = dtStart.addSecs(self.viewLimit)

        ax = self.priceChart.axisX()
        ax.setRange(dtStart, dtLast)

        ay = self.priceChart.axisY()
        dataY = [v.y() for v in pvs]
        ay.setRange(min(dataY) - 10000, max(dataY) + 10000) # 여유가 없는 경우 최대/최소로만 그려짐

    def closeEvent(self, event):
        self.pw.close()

if __name__ == "__main__":
    app = QApplication(sys.argv)
    cw = ChartWidget()
    cw.show()
    exit(app.exec_())
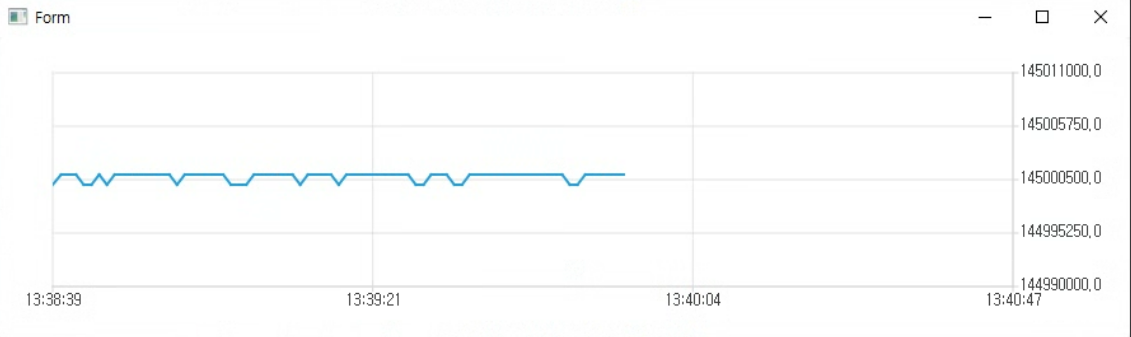
결과
이태훈이(가) 일년 이상 전에 변경 · 1 revisions